MatrixEase vs townhall app
MatrixEase

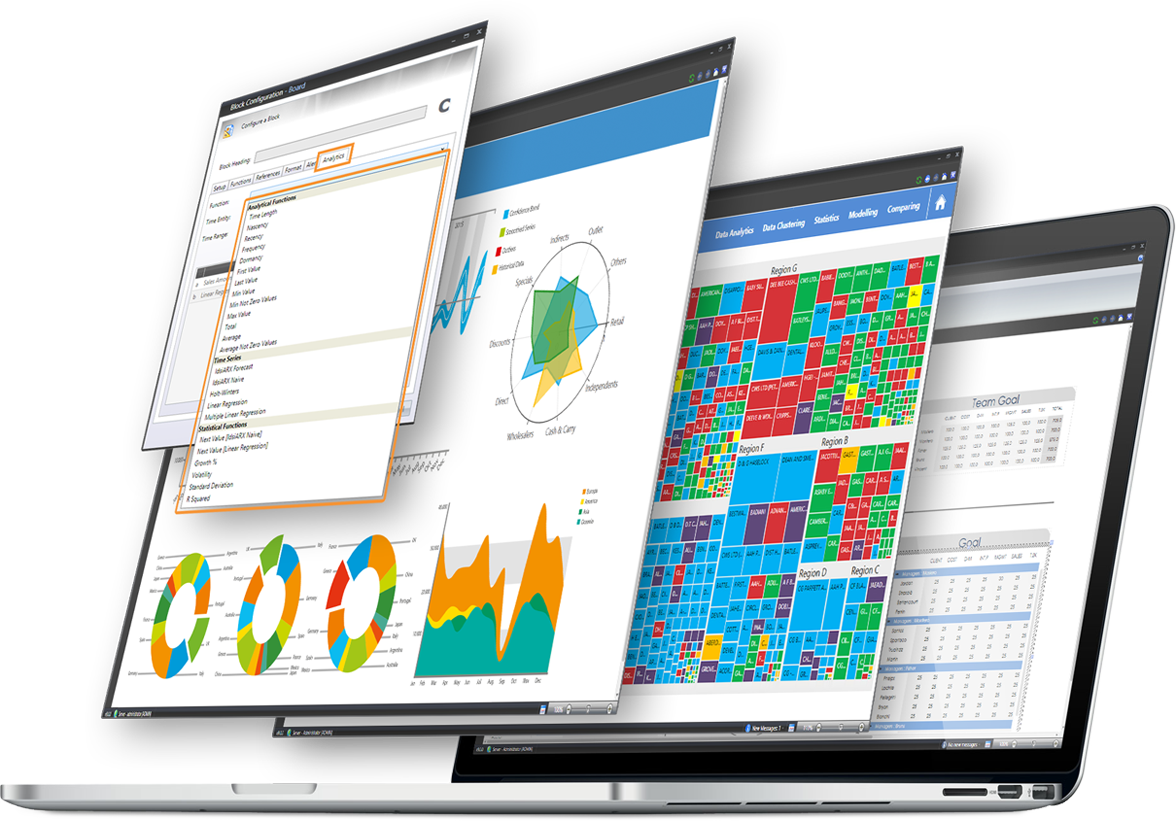
See data the way you think about it - An Innovative Visualization and Analysis Tool for large matrix data
The categorization of text, numeric, date and time elements into easily consumable groups allows the user to be able to visually consume large quantities of data in a compressed/categorized format. The visualization of data also supports visual filtering of the result set to allow further identification of significant data relationships. The system reads in matrix data from your defined source and then automatically categorizes the data into human consumable groups. The system then displays the resultant data to the user in a format that is easily understandable and further allows the user to take action on the data to either further filter or see detailed metrics on the data. The system visually displays the data and categorizations to allow the user to identify significant data relationships.
Location: Branford, United States
Visit Website Visit Twitter PageMatrixEase Explainer Video
MatrixEase Latest Tweets
Tweets by MatrixEasetownhall app

Townhall app is a civic engagement tool designed to distribute democracy and engage citizens in decisions that affect them.
Townhall app is an online survey tool for collecting insights, growing engagement and strengthening community ties. If you want to increase the number of people responding to your survey, you need to make it faster and easier, so we’ve redesigned the way you ask questions and get responses from your target audience. High social media share rates of townhall questions save on the cost of promotion, as word spreads through networks. We help government and community organisations to save money and time in collecting feedback from the people they serve.
townhall app Latest Tweets
Tweets by townhall appMore Comparisons
More Startups You Might Like

Premium Blinds
South Africa's No1 online Blinds Store

Wisebooks
Free database of book recommendations by world-class people
VentuRank
Smart data intake and analytics dashboard for busy VC professionals.
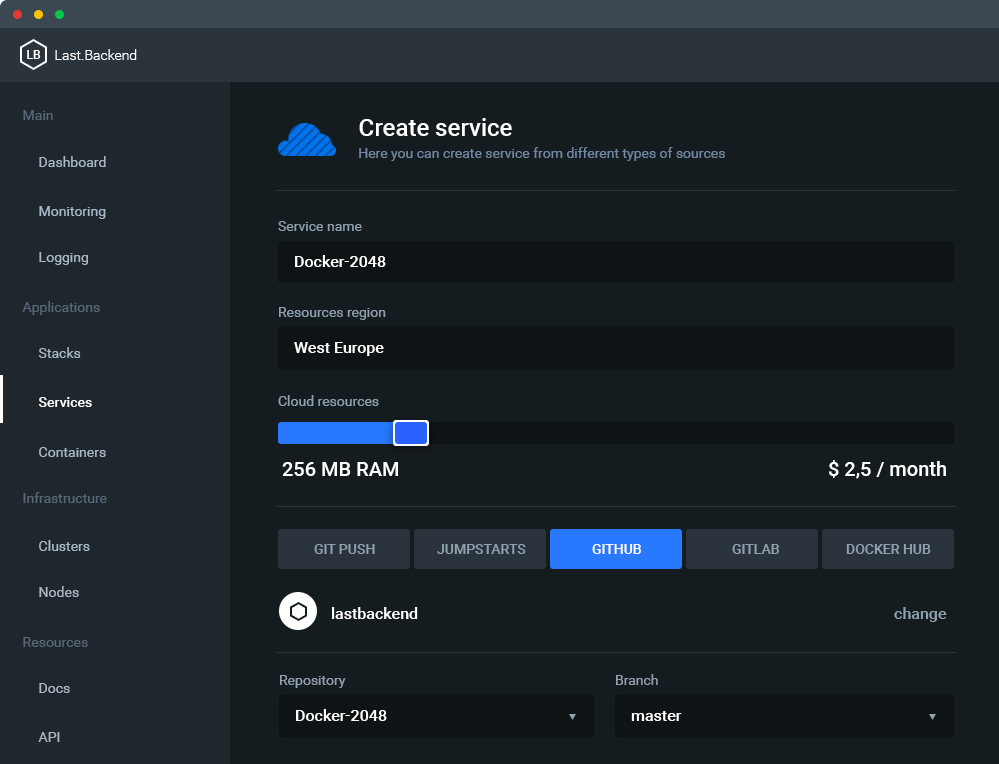
Last.Backend
Last.Backend is a cloud hosting, designed for developers.